Autodesk is a global leader in 3D design, engineering, and entertainment software. Alongside software, Autodesk publishes research and educator resources that advance industry skills training and workforce development. The publications combine narrative and data visualization across print and digital formats. Clear structure and visual hierarchy are essential to how these insights are understood and applied. This requires a clear approach to information design and visual communication. All materials also needed to align closely with existing brand standards.
Just the Project Facts
Designed print and digital research reports with defined hierarchy
Developed custom infographics to translate complex datasets into key insights
Structured key findings reports to convert research into implementation guidance
Created presentation-ready infographics for reports and stakeholder briefings
Worked within Autodesk brand standards and cross-functional stakeholder requirements
Layout and Brand Consistency followed Autodesk’s established standards for color, typography, spacing, and logo use. Infographics and layouts organized dense information through clear hierarchy and emphasis, prioritizing key data across pages. This balanced readability with information hierarchy and a structured visual narrative. Deliverables were developed in collaboration with stakeholders through review and iteration.
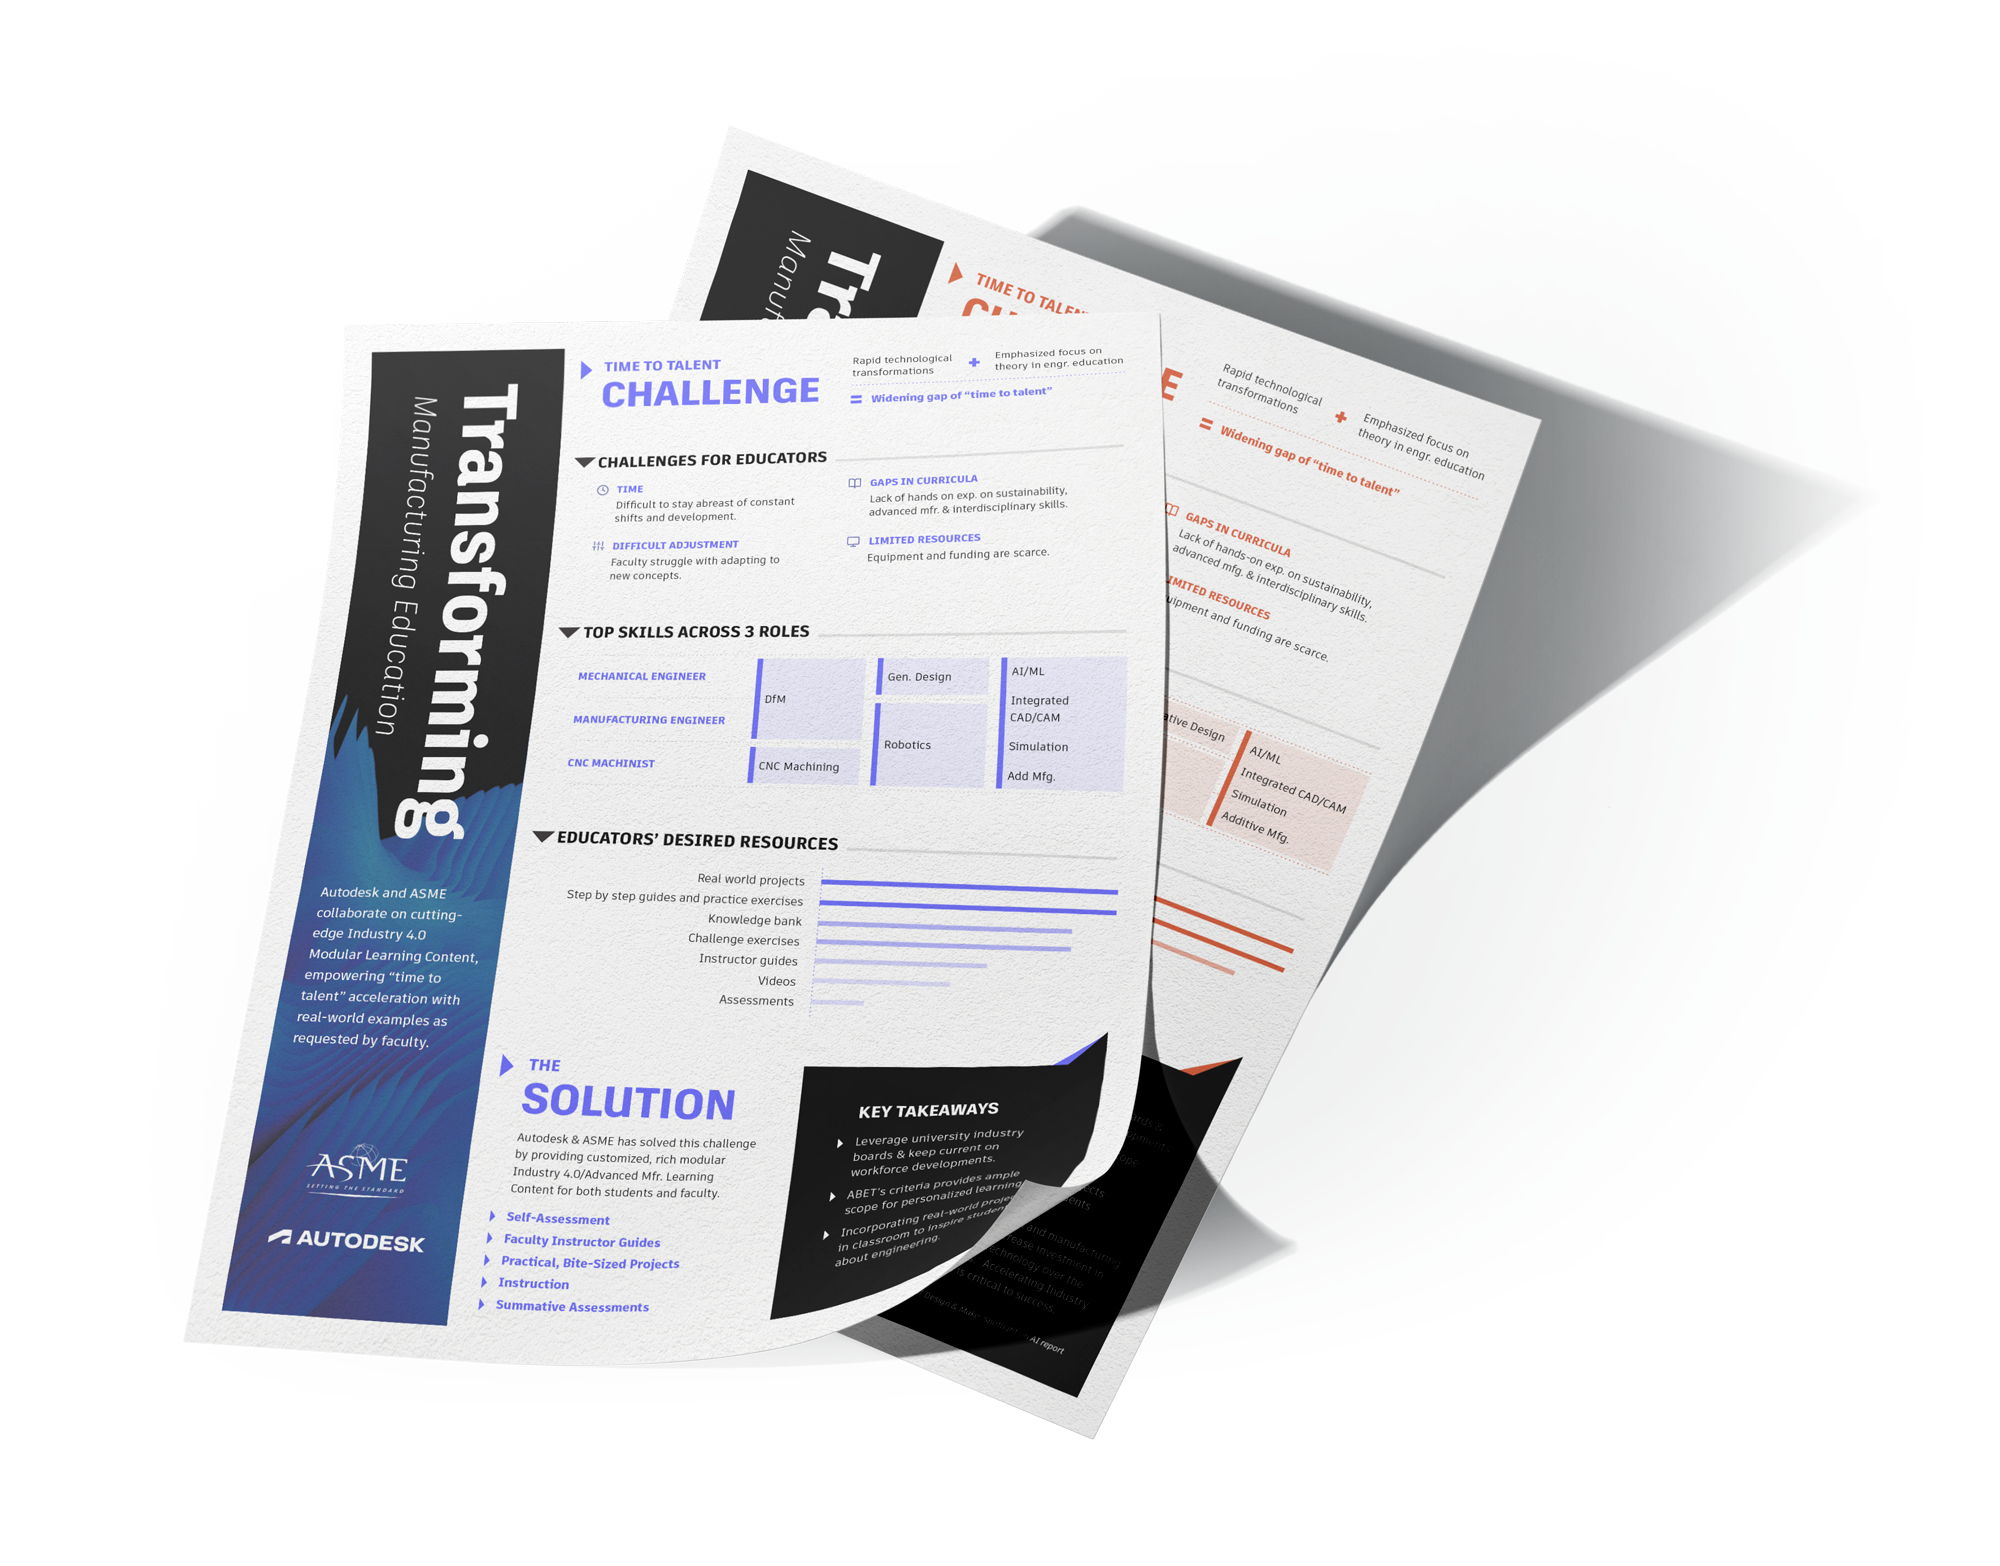
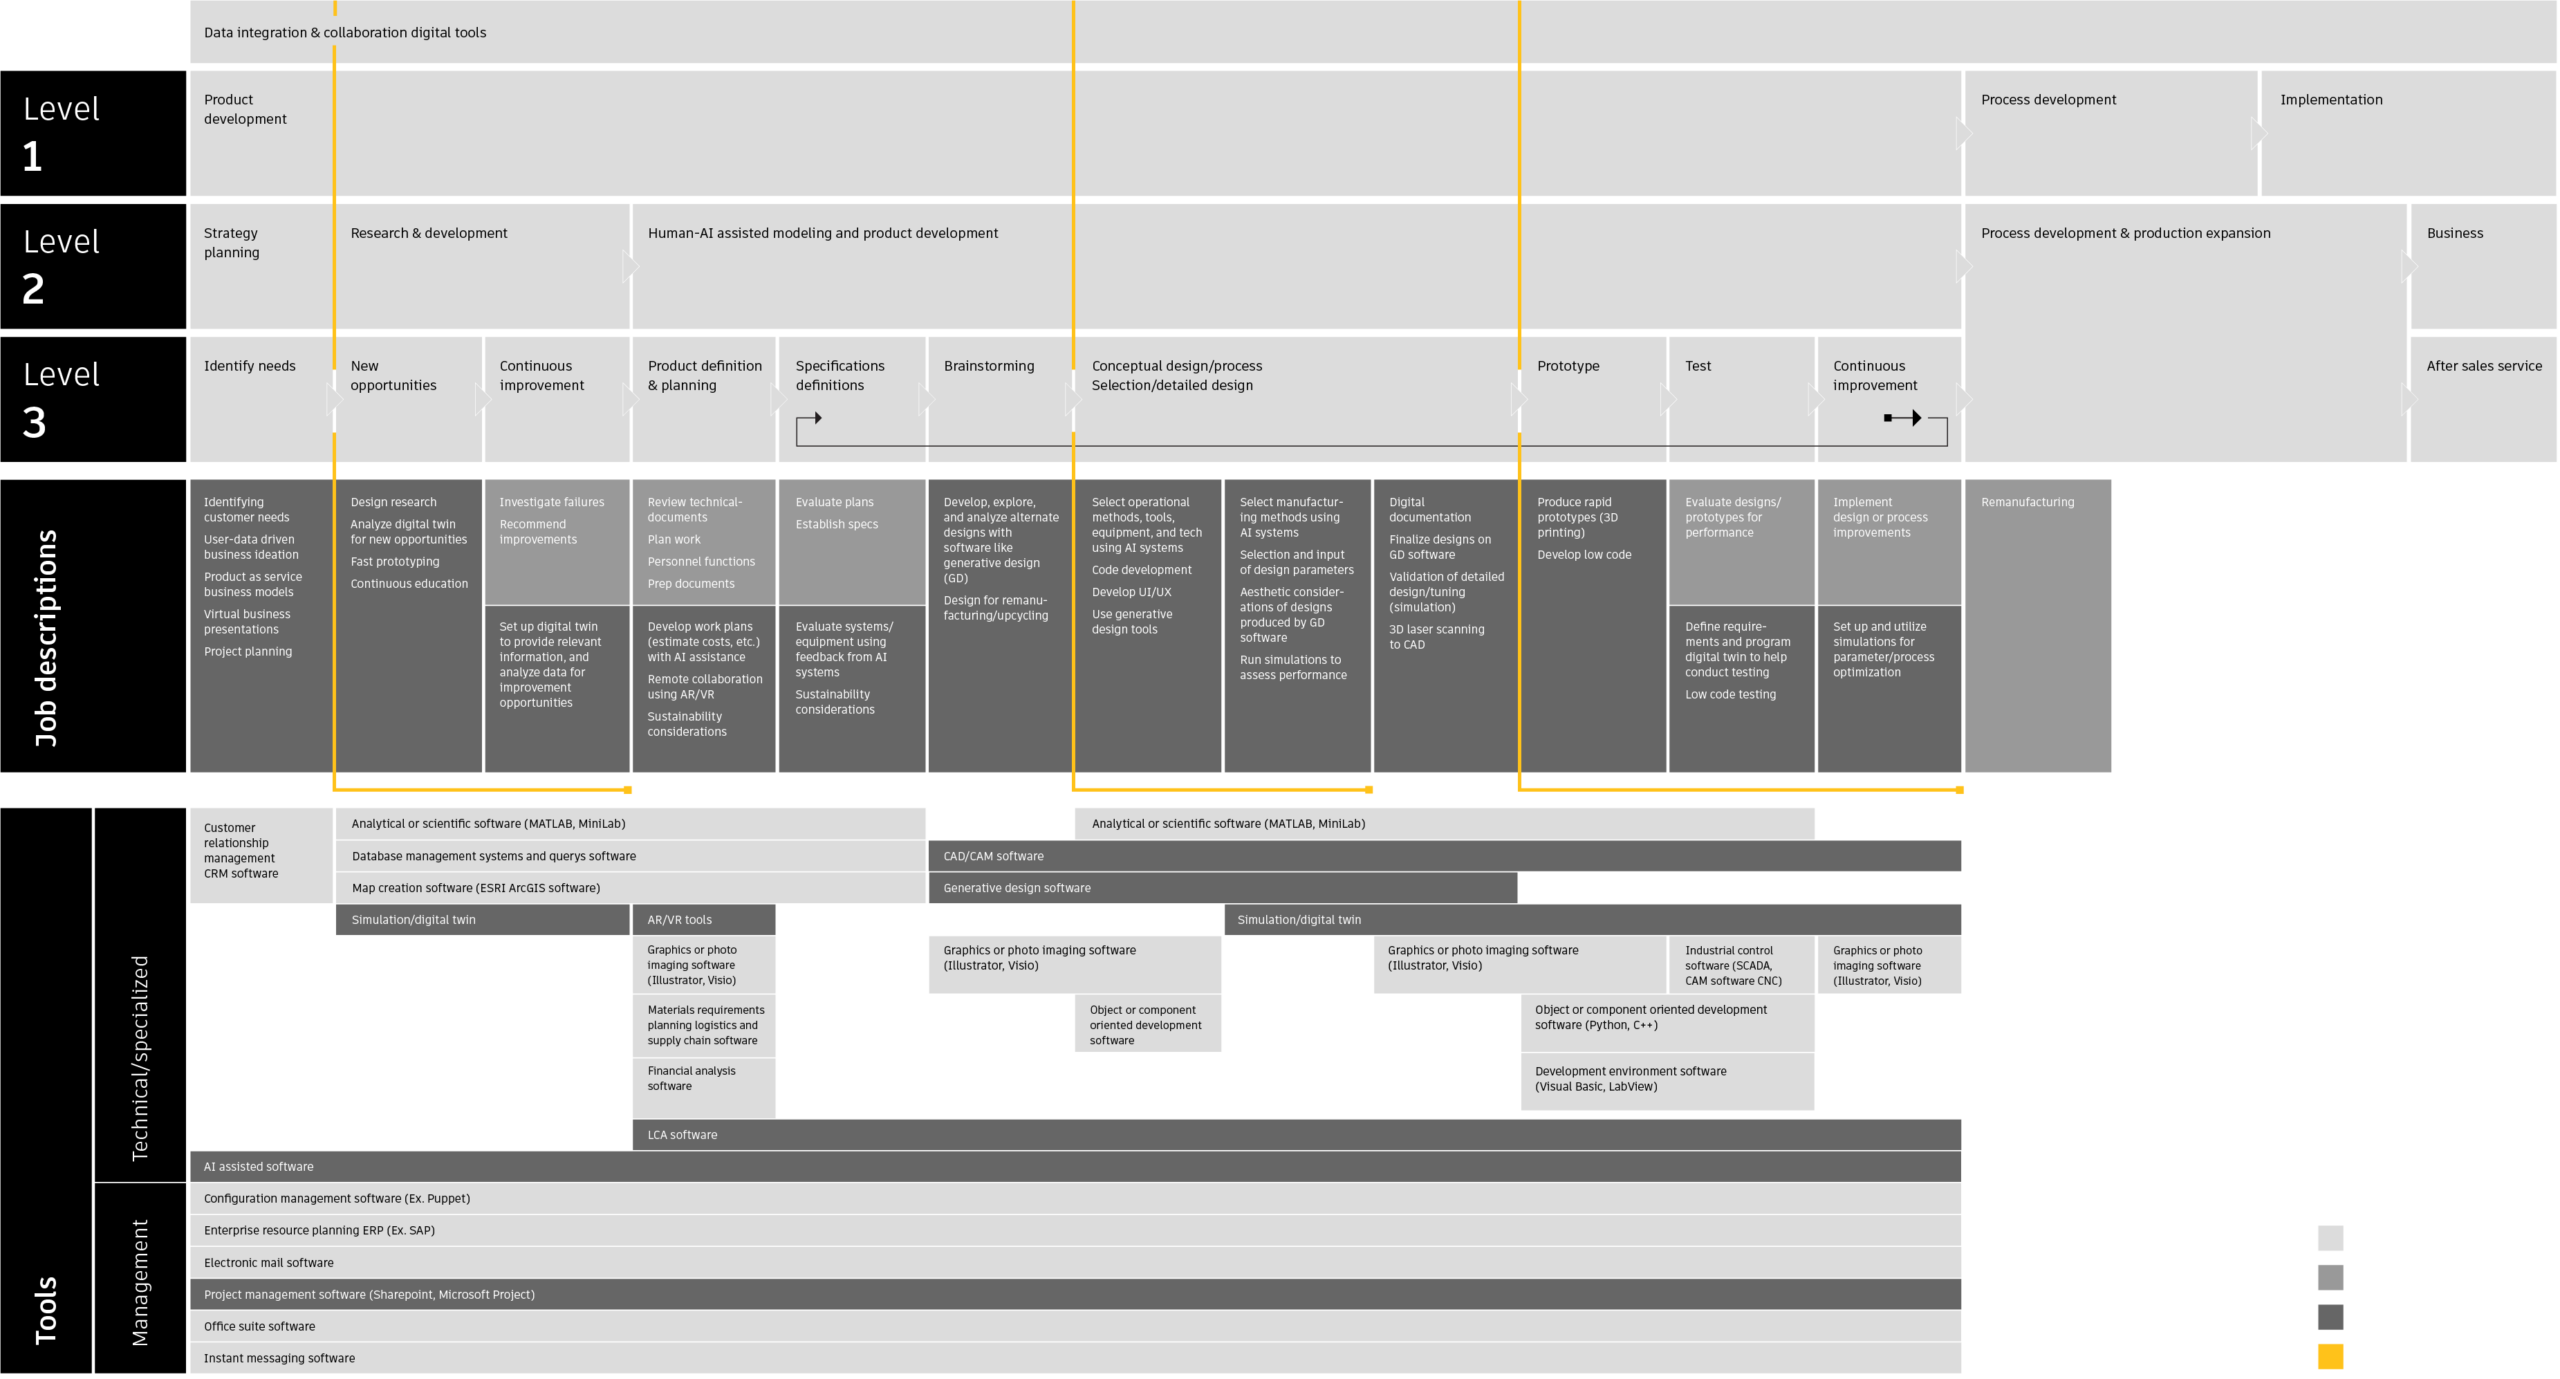
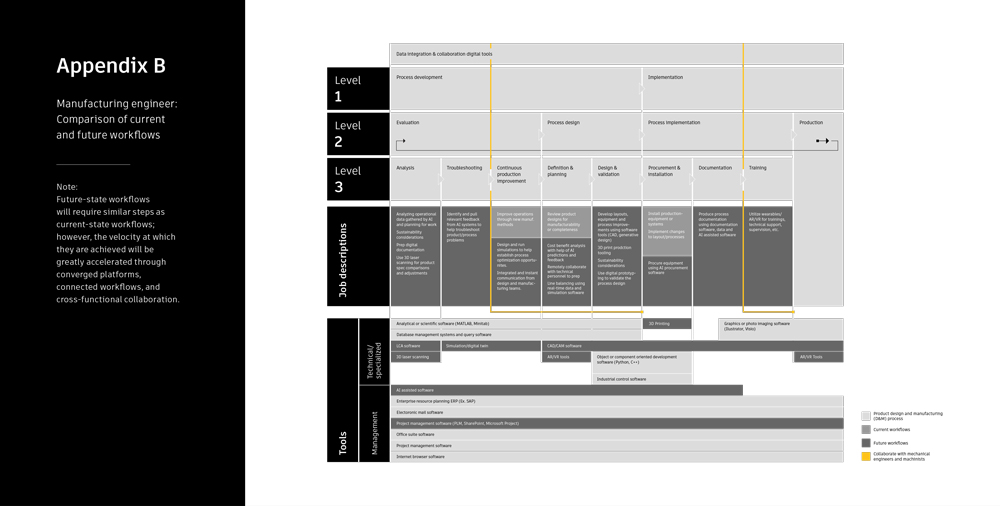
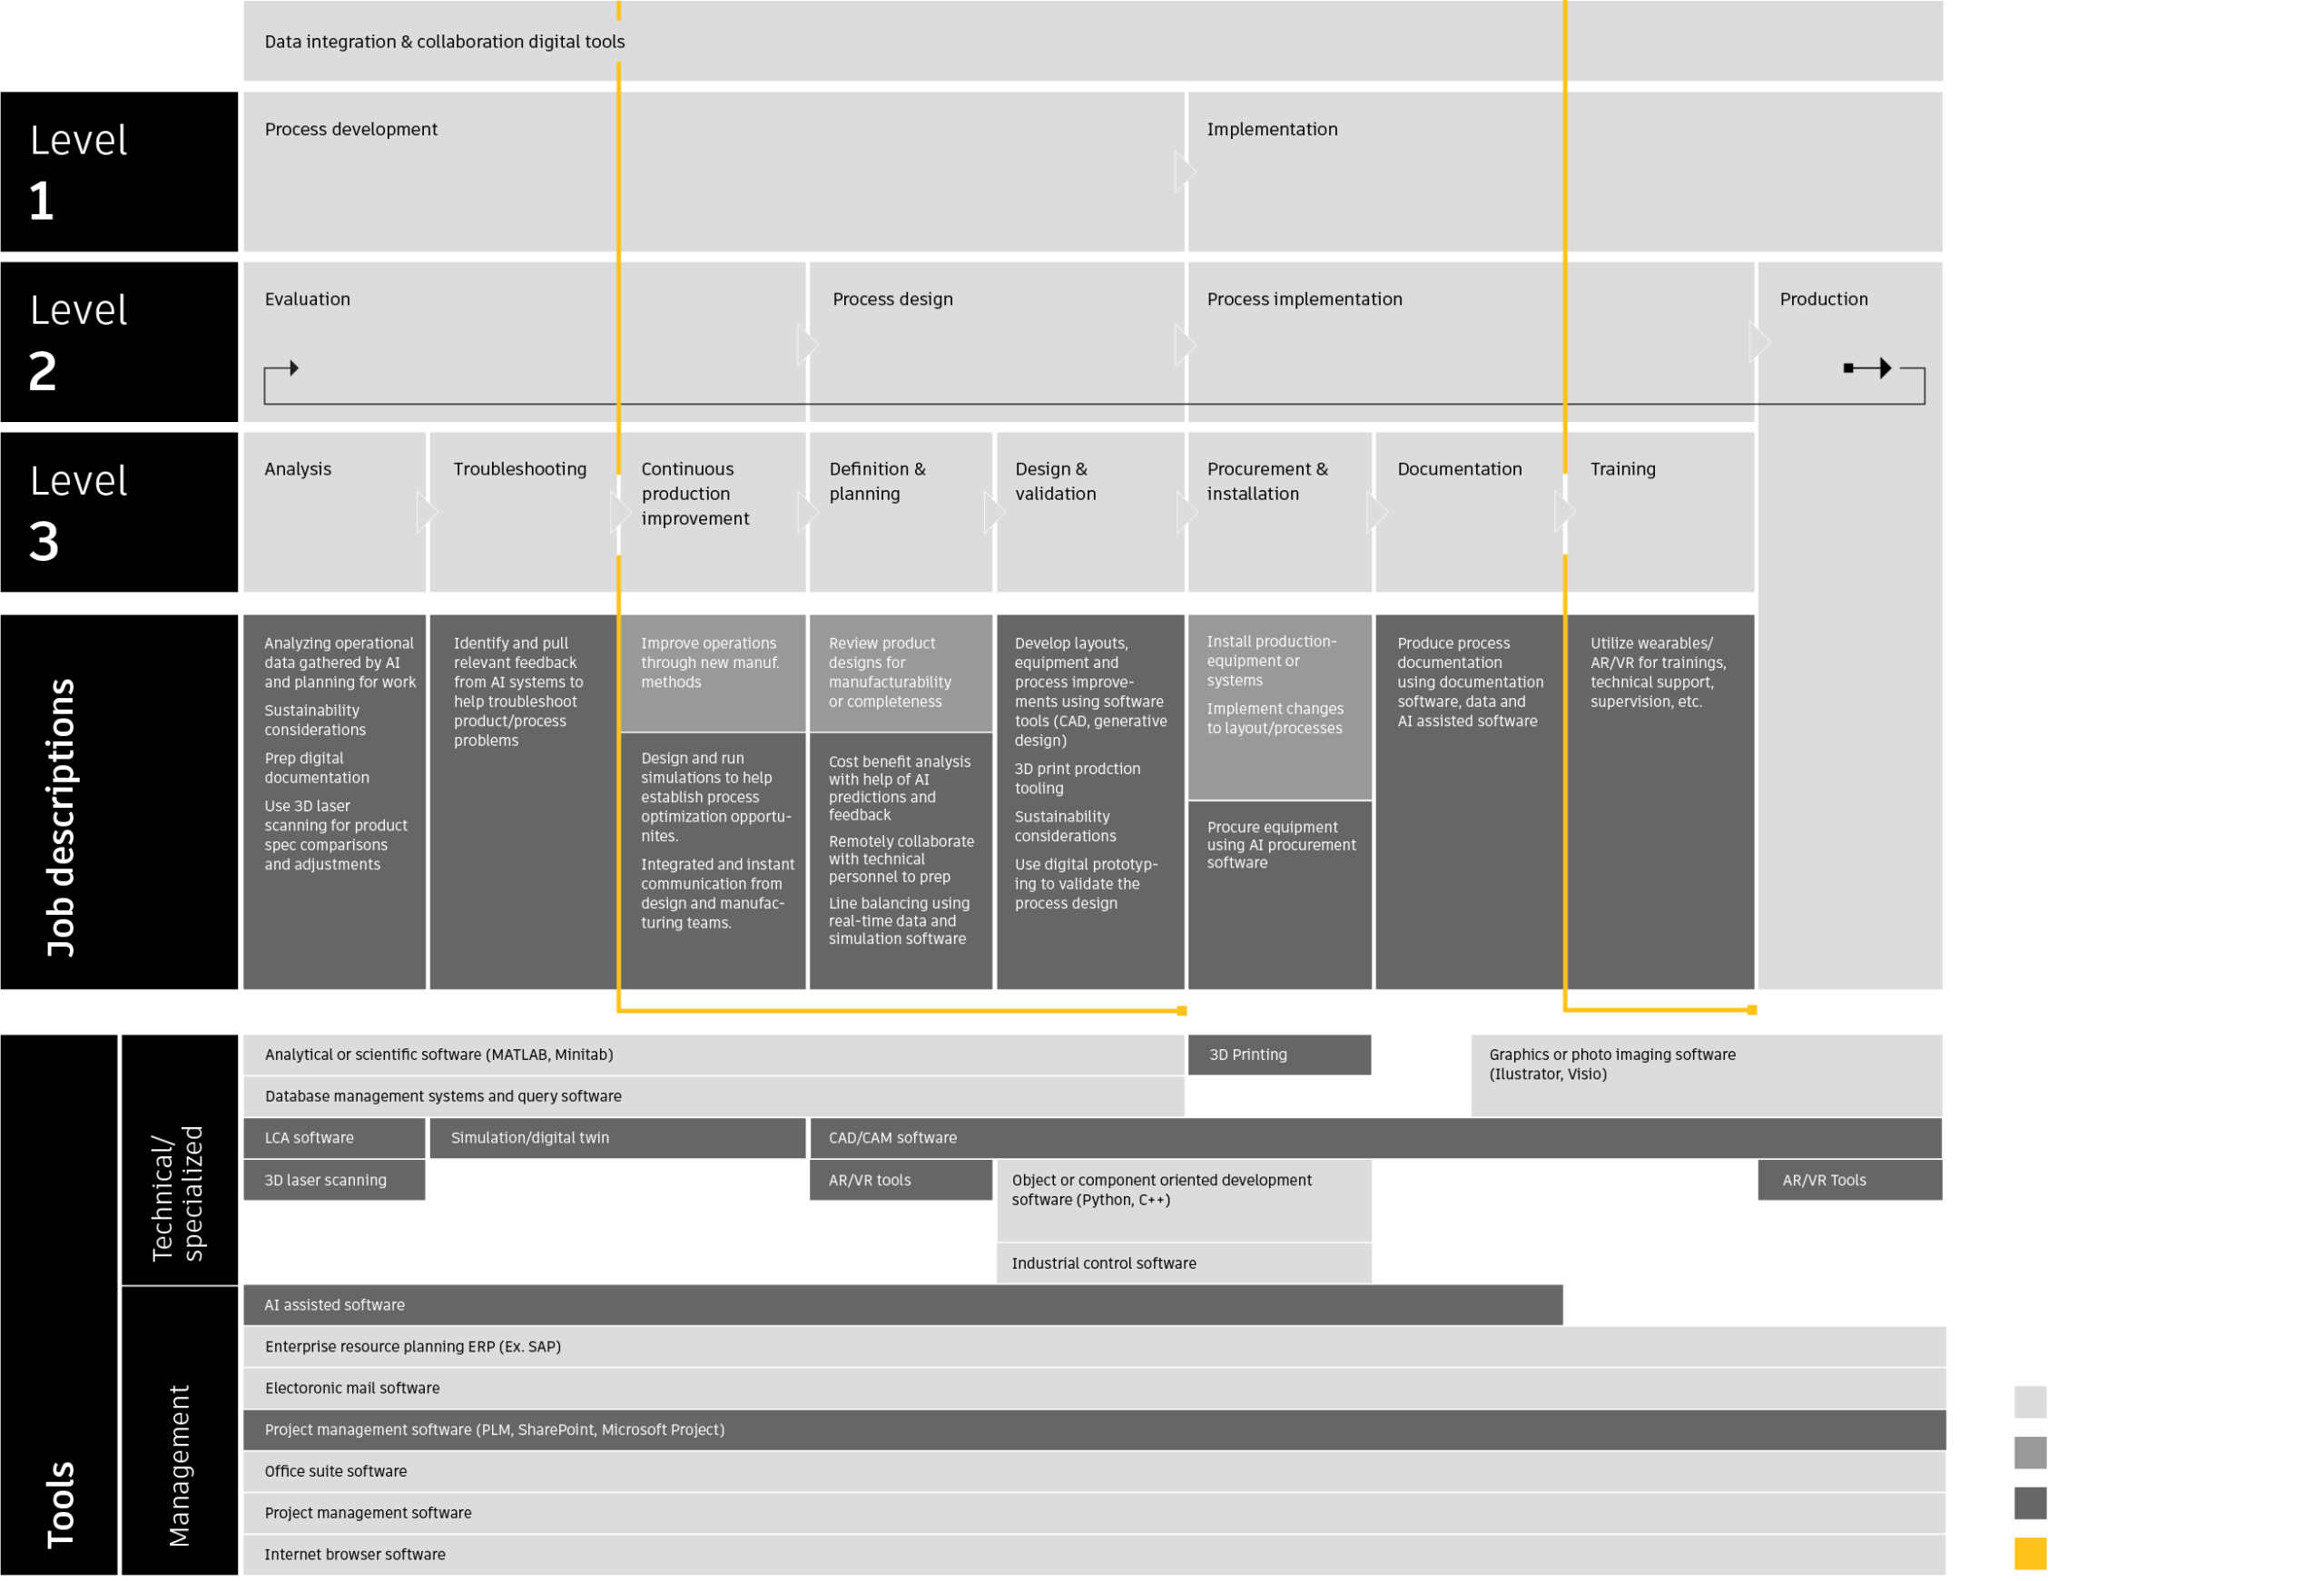
Information Design and Data Visualization translated Industry 4.0 workforce and education data into a set of core infographics used across reports and narrative decks. We visualized Autodesk’s investment continuum to show how differentiated investment shapes customer expectations over time, and outlined the education ecosystem as a range of influences across a student journey. An educator-focused summary outlined how the education ecosystem must evolve for Industry 4.0, highlighting curriculum gaps, resource constraints, and the pace of change, alongside key skill priorities and learning resources. These visuals established a consistent way to interpret the research across all materials.
Complex datasets only make sense when every page speaks the same language. Design systems define how they’re interpreted.